
Voice AI Evaluation Metrics: How to Measure Each One and What Good Looks Like


The metrics that evaluate a voice agent fall into four groups. Here is how each one is measured, what it can't see, and where its bar comes from, with Coval's benchmark data.
You’re deciding what “good” means for a voice agent: the bar it has to clear before launch, and the scorecard you’ll watch once real customers call it. A containment rate, an average latency, a word error rate, and the pass rate from a model grading your calls are all real numbers, and each one sees only part of the call.
Voice AI evaluation metrics fall into four groups:
- Outcome metrics ask whether the caller got what they came for, confirmed in your own systems.
- Policy metrics ask whether the agent followed the rules it can’t break.
- Conversation metrics measure how the call felt: the wait before each reply, the agent talking over the caller, and dead air.
- Speech metrics ask whether the agent heard and spoke correctly.
The numbers the business watches (containment, resolution, and handle time) are outcome metrics counted across production calls, and the other three groups explain why they move.
Our view at Coval is that a metric belongs on the scorecard only when you know what it can see and where its bar comes from. Ask those two questions of every number and four habits follow: confirm outcomes in your backend, hold policy rules to zero failures, read timing and error rates at the 95th percentile instead of the average, and check any score a model gives against human reviewers. The table comes first, then each group in turn.
Voice AI evaluation metrics at a glance
Some bars hold for any agent: zero failures on policy rules, a pickup under a second from Coval’s docs, and our public speech benchmark’s numbers (the 30 days to November 11, 2026) for the speech rows. The rest can only come from your own calls, because a password-reset line and an insurance-claims line shouldn’t share a containment target. Each section says where that baseline comes from.
| Group | Metric | How it’s measured | What good looks like |
|---|---|---|---|
| Outcome | Task completion (resolution rate in production) | LLM yes/no check, confirmed in your backend | Your baseline from today’s calls |
| Outcome | Containment | Calls ended with no transfer to a person ÷ calls the agent answered | Your baseline, read beside resolution |
| Outcome | Early hang-up rate | Calls the caller ends before stating a need ÷ answered calls | Your baseline, per greeting version |
| Outcome | Average handle time | Answer to hang-up, averaged across calls | Your baseline, with resolution holding |
| Policy | Must-always and must-never rules | Pattern match on the transcript; LLM yes/no check for behavior | Zero failures |
| Policy | Invented answers (hallucination) | Each transcript scored against your facts and grounding rules | Zero failures |
| Conversation | Response latency | Silence from the caller’s last word to the agent’s reply | Simulated baseline, read at p95 |
| Conversation | Time to first audio at pickup | Recording start to first audible sound | Under 1,000 ms (Coval docs) |
| Conversation | Interruption rate | Times per minute the agent starts talking over the caller | Simulated baseline; flag any rise |
| Conversation | Dead air and re-prompting | Agent silent when it owes a reply; caller has to ask again | Simulated baseline; flag any rise |
| Speech | Speech-to-text word error rate | (Substitutions + deletions + insertions) ÷ words actually said | Top of Coval’s leaderboard (Universal 3.6 Pro): 2.1% average, 12.5% p95 |
| Speech | Text-to-speech time to first audio | Synthesis request to first audible sample | At or under Coval’s leaderboard middle (225 ms), with a tight p95 |
Outcome metrics show whether the caller got what they came for
Start with task completion, because the business numbers are built from it: did the agent do what the caller called to do? Coval scores it with an LLM judge, a language model that reads the call and answers a yes/no question you write, such as “Did the agent move the appointment to the requested day?”
A transcript has a blind spot, though: it records what the agent said, not what happened. “You’re all set for Thursday” reads as a success even if the booking never reached your system. With Coval’s API State metric, Coval calls your backend after the call and checks that the field you name holds the value you expected. Chime, a Coval customer, tests this way: it creates a user through its API before a simulated call, then checks card status and account freezes with a follow-up API call.
Counted across production calls, task completion becomes your resolution rate: calls where the caller’s goal was verifiably met, divided by all calls the agent handled. Three more business numbers sit beside it:
- Containment is the share of calls the agent finishes without handing off to a person. The contact-center platform Five9 defines self-service containment as interactions “fully resolved by an automated system” without a transfer. A plain count of calls with no transfer also counts callers who hung up unhelped, so read containment beside resolution.
- Early hang-up rate catches those callers at the door: answered calls the caller ends before saying what they need (or within a fixed window after the greeting), divided by all answered calls. Compare it across greeting versions and next to the wait at pickup, since a long silence drives callers off.
- Average handle time runs from answer to hang-up. Shorter is only better while resolution holds: an agent that rushes callers off the phone cuts both.
Before launch, measure all four on the calls your team or current phone system handles today; after launch, the agent’s own first weeks become the baseline. A move matters when it holds across a whole run of calls, not when one bad call shifts the number.
Policy metrics are floors, not points in an average
Policy metrics ask whether the agent stayed inside the rules: reading a required disclosure, verifying identity before sharing account details, transferring to a person when the caller asks, and never quoting a fee you don’t charge.
Coval checks exact wording with phrase matching: a pattern that must appear in the transcript or, to enforce “never say X,” one that must be absent. Behaviors take judgment, so a yes/no judge checks them (“Did the agent confirm the caller’s date of birth before reading the balance?”). Invented answers are checked by scoring each transcript against the facts and grounding rules you supply.
The bar is zero failures, kept as its own line on the scorecard. Fold a compliance miss into a blended quality score and a warm, fast call that invented a refund policy averages out to “pretty good.” So don’t weigh policy adherence against naturalness at all. A policy failure fails the call.
Conversation metrics measure how the call felt
This group and the next are what a chatbot scorecard doesn’t have: a transcript of a call with a four-second pause before every answer reads the same as one with none.
- Response latency. For each call, Coval’s Latency metric averages the silences of half a second or more between the caller finishing a turn and the agent starting to respond. Read that figure at p95 across calls to see how slow your slowest calls run overall; a single long pause in an otherwise quick call needs a turn-by-turn look. Our latency guide breaks it down by stage.
- Time to first audio at pickup. The caller’s wait to hear anything, from the start of the recording to the first audible sound. Coval’s docs call under 1,000 ms responsive, 1 to 3 seconds acceptable, and above 3,000 ms noticeable lag. It’s a separate measurement from the voice model’s own time to first audio, covered under speech.
- Interruption rate. How often the agent starts speaking while the caller is still talking, per minute. A rise points to a turn-taking problem worth tracing back to endpointing, the setting that decides when the caller has finished.
- Dead air and reprompting. Dead air is the agent going quiet when it owes a reply, and Coval flags it once the silence after the caller’s turn passes five seconds by default. Reprompting catches shorter stalls, counting each time the caller has to speak again after two seconds or more without an answer.
For everything but the pickup wait, take the baseline from simulated runs and read it at p95.
Speech metrics show whether the agent heard and spoke correctly
For agents built from a speech-to-text (STT) model that transcribes the caller and a text-to-speech (TTS) model that voices the reply, these metrics check each end.
Word error rate (WER) counts the edits needed to turn the model’s transcript into what was actually said: (substitutions + deletions + insertions) ÷ words in the reference. Our public speech benchmark runs 30+ speech-to-text models on audio that sounds like real calls, with accents, background noise, distant mics, and phone-line compression. Over the 30 days to November 11, 2026, AssemblyAI’s Universal 3.6 Pro ranked first of 32 there with a 2.1% average WER. Its p50 was 0.0%, so at least half its clips were transcribed perfectly. Its p95 was 12.5%: one clip in twenty scored 12.5% or worse. The 2.1% average describes neither.
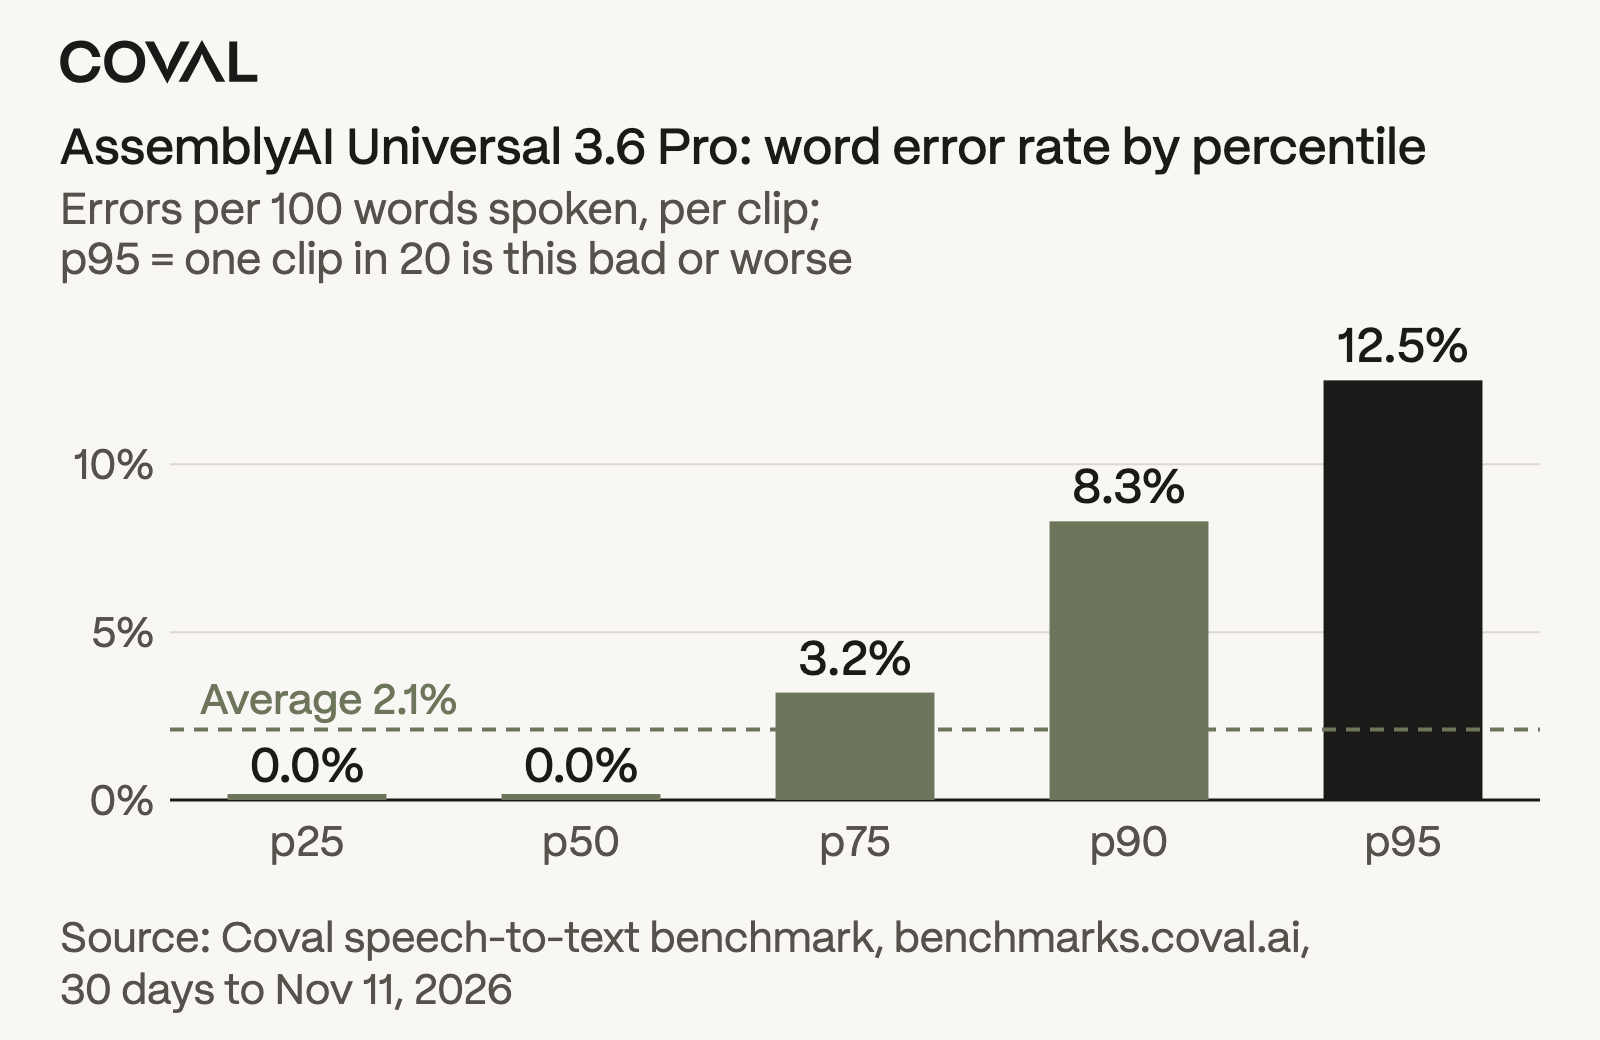
Word error rate by percentile for AssemblyAI’s Universal 3.6 Pro, first of 32 on Coval’s STT benchmark over the 30 days to November 11, 2026. The 2.1% average sits between a perfect median and a 12.5% p95.
On your simulated calls, Coval’s STT Word Error Rate metric measures your agent’s word error rate against Coval’s reference transcript of what the simulated caller said, so nobody labels the right answer by hand. Even a low WER can hide the error that matters: one misheard digit in a confirmation number barely moves the score but fails the call. So check each readback of an account number, date, or name as its own yes/no question.
TTS time to first audio is the wait the voice model adds, which our benchmark times from the synthesis request to the first sound a listener could hear. The TTS leaderboard ranks its 32 models by average, and the middle sits at 225 ms. What makes a result good is a tight spread: ElevenLabs Flash v2.5 averages 207 ms, with 199 ms at p50 and 278 ms at p95, so its slow requests land about 80 ms behind its typical ones. Where the timer stops matters too: Cartesia Sonic 3.6 averaged 284 ms, and 134 ms of that was silence at the start of its audio, invisible to a timer that stops at the first bytes.
Speaking correctly gets the same test as hearing: we transcribe each model’s synthesized speech and score its WER, and Sonic 3.6 ranks third of 32 at 1.6%. For any of these numbers, shortlist providers on p95 from our leaderboards, then confirm on your own audio, because your callers’ accents, phone lines, and vocabulary all move them.
A model-scored metric needs its own check against people
Task completion and policy behaviors are scored by an LLM judge, which can be wrong, and raw agreement with human reviewers can hide how often. Coval’s docs give the example: suppose humans mark 95 of 100 calls as successful. A metric that marks all 100 successful agrees with them 95% of the time and catches none of the five failures.
So for each yes/no metric, Coval reports two more numbers. Catch rate is the share of human-flagged failures the metric also flagged, which is zero in that example. Agreement beyond chance discounts the agreement you’d get from the mix of answers alone, so a judge that says YES to everything scores zero.
When the judge and the people disagree, read the disputed calls. A team running an outbound voice agent found its AI-disclosure metric agreed with human labels on 89% of 314 conversations. The agent confirms who it’s talking to before saying it’s an AI, and in all 35 disputes the wrong person had picked up or the caller had hung up before then. Those calls never reached the disclosure, yet the judge failed the agent on them. One paragraph in the judge prompt fixed the metric, not the agent; our post on trustworthy judge metrics walks through the calibration.
Because a judge can misread calls like these, Coval’s human review puts failures, edge cases, and low-confidence calls at the top of the review queue. People review the calls your rules flag, not every call.
Run the same metrics before launch and on every production call
A launch bar only means something if production is scored the same way. In Coval, every metric works on both simulated conversations and live production calls. Before launch, simulated callers with the accents and background noise of real callers phone your agent. After launch, every production call is scored on the same definitions, with no sampling, and alerts tell you when a metric breaks its bar or drifts from its baseline. A failed production call can then become a test case for the next simulation. Our evaluation guide covers the process around these metrics.
Build a scorecard you can defend
Your launch bar, then, is zero policy failures, a pickup under a second, timing and speech numbers that hold at p95 in simulation, and outcomes confirmed in your backend at least as often as today’s calls resolve. Your production scorecard is the same definitions on every call, with containment, resolution, and handle time on top. To see where your agent stands today, score a set of your real calls on these metrics.