
Voice Load Testing: Sizing, Limits, and Ramps


A load test should prove your agent can handle real peak traffic, not just launch many calls. Measure connected load, compare it with a low-load control, and find the first limit.
Requesting 1,000 test calls does not mean your agent handled 1,000 callers at once. With steady dialing at one call per second and calls lasting three minutes, the test settles at about 180 concurrent calls. Twilio’s Voice API defaults to 1 call per second and queues the rest, so your test can reach the dialer’s limit before it ever tests the agent’s capacity.
Voice load testing means holding simultaneous conversations over the real call path to see whether they still work at the volume you expect. Size that volume from your busiest hour, increase connected calls at a pace the dialer and platform can sustain, and compare each level with a low-load control. We’ll work through the sizing calculation, locate the limits between caller and model, and build ramp, spike, and soak tests that reveal where performance breaks.
Key takeaways
- Size from your busiest hour: 900 three-minute calls need capacity for 58 simultaneous calls, or 75 if load stretches calls to four minutes.
- The first limit can sit outside the agent: Twilio dials 1 call per second by default, and Retell’s default pool is 20 calls.
- Ramp in steps of 10 to 20 calls, hold each level for two call lengths, and climb until a pass/fail rule breaks.
- Judge each level against a 60-call baseline run at low load before the ramp, and run a one-call control alongside to catch provider drift.
- Size spikes by calls per second, not by a fixed call count.
- A pass means the conversations still work at load: calls end normally, callers rarely repeat themselves, and turn latency stays near the baseline.
Voice load testing has to hold whole conversations over the real call path
A call holds capacity from connection to hang-up, carries context between turns, and crosses services your local tests may skip. The test caller must keep listening and responding while carrier, platform, speech, and backend limits are under load, and realistic multi-turn conversations show whether later answers still use earlier information correctly.
Run those conversations over the deployed path, including the carrier and SIP (the Session Initiation Protocol, which sets up each phone call), because local evals can omit sustained load, queueing, service limits, and real transports. Coval’s guide warns that an overloaded agent produces “failed or hung simulations that look like results but are not,” so confirm the test reached its intended load before reading any scores. Compared with the functional testing you already run, a load test asks a different question:
| Aspect | Functional testing | Voice load testing |
|---|---|---|
| Question | Does the agent handle this call correctly? | Does it still handle calls correctly at peak volume? |
| Calls at once | One, or a few | Many, sized from your busiest hour |
| Duration | One call | Minutes to hours: ramp, spike, and soak |
| Pass rule | The right outcome | The right outcome, on time, at every load level |
| What it finds | Logic errors and wrong answers | The first limit: dialer, carrier, platform, provider, backend, or a leak |
Size the test from busy-hour calls and handle time, with blocking headroom
A load test’s target concurrency comes from two figures in your own call data, calls in the busiest hour and average handle time, plus headroom for the minutes when calls bunch up. The first two give the average:
Little’s law: the average number of calls in progress equals the arrival rate times the average time each call lasts (L = λW).
Averages hide bunching. Calls arrive at random, so some minutes carry more than the average. The Erlang B formula gives the probability that a call finds every channel busy, given the number of channels and the offered traffic, which is the average load your callers bring before any of them is turned away. The ITU-T publishes it as an Erlang B table at 1%, 3%, 5%, and 7% loss.
Erlang: a unit of call traffic; one erlang is one call in progress for a whole hour, so 45 erlangs is an average of 45 calls at once.
For an agent that takes 900 calls in its busiest hour at an average of 3 minutes each:
Inputs: 900 calls in the busiest
hour, 3-minute average handle time

Arrival rate:
  λ = 900 ÷ 3,600 s = 0.25 calls/s
Offered traffic:
  A = λ × W
  A = 0.25 × 180 s = 45 erlangs
Erlang B at 1% blocking:
  57 channels carry 44.22 E
  58 channels carry 45.13 E
  → size the test to 58

If slower turns stretch calls
to 4 minutes (240 s):
  A = 0.25 × 240 s = 60 erlangs
  74 channels carry 59.80 E
  75 channels carry 60.73 E
  → size the test to 75
The table assumes calls arrive at random and that a caller who finds every channel busy is turned away rather than held in a queue. On a platform that holds callers for a while first, treat the result as a planning estimate rather than an exact figure.
The second calculation is the one that catches a slow agent. If load slows each turn, calls get longer, and at the same arrival rate longer calls put more of them in progress at once: one extra minute per call takes this agent from 58 channels to 75. Size the ramp for the longer handle time.
Whether a test can even place 58 calls at once depends first on the dialer placing them.
The test’s own dialer can cap the load and misreport it
The dialer has two limits to account for before the agent hears a call: calls per second (CPS), the rate at which new calls start, and concurrent channels, the calls that can remain connected. Exceeding the rate can queue calls; exceeding the channel limit can reject them. The vendor limits and prices used throughout this guide reflect November 2026; confirm the allowances for your account before scheduling a run.
Accounts with an approved Business Profile can configure Twilio’s Voice API setting to as much as 5 CPS; approval alone doesn’t change the 1 CPS default. Calls over the configured rate wait in the queue. Twilio’s SIP trunks default to 1 CPS per trunk per region, adjustable from 1 to 5, and reject calls past the limit with error 32001, “SIP: Trunk CPS limit exceeded.” Inbound calls aren’t limited by CPS, so for an inbound agent the rate that binds is the one on the account placing the test calls.
Queueing and rejection fail a test in opposite directions. A harness behind a queue reports the calls it requested, not the ones that connected, so it can claim a concurrency the agent never saw. A trunk that rejects produces failed calls that look like the agent’s fault. Little’s law gives the average concurrency a dialer can sustain: the opening’s 1 call per second yields 180 calls in progress, and the 5 calls per second Twilio allows with an approved Business Profile yields 900:
Estimated steady-state average
concurrency =
  connected call starts per second
  × average connected call duration

  5 starts/s × 180 s
  = 900 calls on average

Time to dial a step of n calls
  = n ÷ CPS

  58 calls at 1 CPS = 58 s
  58 calls at 5 CPS ≈ 12 s
Measure connected starts and calls in progress rather than the calls your harness requested.
Other carriers cap channels instead of rate. Telnyx starts accounts at 2 concurrent outbound calls and raises that to 10 after Level 2 verification, so a larger test from a new account needs a further increase from its support team first. Twilio’s account channel limit rejects extra calls with error 86008.
Contact centers, agent platforms, and model providers each publish a limit, and the lowest one binds
Each layer that answers the call publishes its own cap: the contact center, the agent platform, and the speech-to-text (STT), text-to-speech (TTS), and LLM providers behind it. The lowest one sets how many calls your agent can hold. Some caps hold a slot for the whole call; others count only requests in flight or new sessions per minute, and the table marks which is which.
| Layer | Documented default | At the limit | Max 3-minute calls per hour (1% busy) |
|---|---|---|---|
| Amazon Connect, per instance | 10 concurrent active calls, counting PSTN and WebRTC calls and calls waiting in queue | Reorder tone, also called a fast busy | 89 |
| Retell, Pay-As-You-Go | 20 concurrent calls per workspace | Outbound rejected unless burst is on; inbound waits about 40 s, then goes to a fallback number or ends with concurrency_limit_reached | 241 |
| Vapi | 4, 10, or 30 lines (Usage only, Core, Pro) | No new inbound or outbound call; concurrencyBlocked is true | 89 (Core), 407 (Pro) |
| Pipecat Cloud, Daily-hosted region | Default pool of 50 per deployment, one session per instance | 429 response | 758 |
| Deepgram, Pay-As-You-Go | 45 Voice Agent API connections; 150 streaming STT; 45 Aura TTS streams | Per-project limit; more via a Growth or enterprise agreement | 669 (Voice Agent API) |
| ElevenLabs, Pro | 20 Flash and Turbo requests; 10 for other models | Queued, then HTTP 429 | n/a: requests in flight |
| Cartesia, Scale | 15 Sonic TTS requests; 60 Ink STT | Separate pool per service | n/a: requests in flight |
| AssemblyAI streaming, paid | 200 new sessions per minute to start, up 10% after a minute at 80% use | WebSocket closes with code 1008, “Too many concurrent sessions” | n/a: a rate, not a pool |
| OpenAI | Requests and tokens per minute | HTTP 429 | n/a: tokens, not calls |
The last column applies the Erlang B table to limits that a call holds from start to finish: it’s the most three-minute calls a pool can take in your busiest hour while no more than 1 caller in 100 finds it full. At that 1%, pools of 10, 20, 30, 45, and 50 carry 4.46, 12.03, 20.34, 33.43, and 37.90 erlangs, and each erlang is 20 three-minute calls an hour. A pool of 20 therefore handles about 241 calls in the busiest hour, not the 400 that 20 × 20 suggests, because random arrivals bunch. Retell holds inbound callers for about 40 seconds before sending them to a fallback number or ending the call, so read its figure as an estimate. Amazon Connect’s figure assumes your agent answers every call as soon as it connects. Calls waiting in its queue count toward the 10 too, so any queue time lowers that figure.
The rows marked n/a don’t hold capacity for a whole call. ElevenLabs counts “concurrent requests running in parallel,” so a call uses its TTS limit only while a reply is being synthesized.
Architecture sets how many of these limits an agent inherits. A cascaded agent, which chains speech-to-text, an LLM, and text-to-speech, inherits a limit from each provider plus its platform’s, while an agent built on a hosted voice-agent API inherits that API’s connection limit, as in Deepgram’s row. Coval’s comparison of speech-to-speech vs cascaded designs covers the other trade-offs. Region matters too: on Deepgram’s Growth plan, the streaming STT limit is 225 in North America and 150 in Europe.
Your own backend, network, and hosts belong on the list too. A booking API that tops out below your Erlang target is a limit like any other. Budget about 160 kbit/s per call for G.711, the 64 kbit/s phone audio format: each direction carries 80 kbit/s once the 40 bytes of IP, UDP, and RTP headers ride on every 20 ms packet. That comes to 12 Mbit/s for 75 calls. Model tokens and host memory grow with every call too, since each multi-turn request carries the conversation history, so measure both per call in the control run and multiply by your top level.
Isolate the test from live callers, who draw on the same pools
A load test using production’s capacity pool competes with real callers for the same slots. Retell’s pool belongs to a workspace, so a live caller who arrives while a test fills it gets the wait or fallback number from the limits table. Vapi shares concurrency across the organizations in a subscription, and OpenAI sets its limits per organization and per project.
Deepgram leaves the least room: its limits apply per project, and its terms forbid spreading traffic across projects to get around them, so a Deepgram-backed test shares production’s limit.
Pick an isolation plan before the first call:
- Use a separate pool where the platform sells concurrency per workspace or subscription, sized to the test.
- Buy temporary headroom. For the 58-call target, Retell needs 38 slots above its default 20 at $8.00 per concurrency per month, or $304, and Vapi Pro needs 28 lines above its 30 at $10 per line per month, or $280. Those prices buy 58 total slots; provision additional capacity for any live traffic sharing the pool. The control runs on its own deployment, described below.
- If the pool must be shared, test off-peak with a fallback number configured, and stop the moment a real caller is held or blocked.
- Point tool calls at sandbox endpoints, so test calls don’t book real appointments or charge real cards.
Isolation takes live callers out of the comparison, but the providers behind the agent still carry everyone else’s traffic, so a slow minute can come from them rather than from your load.
Compare every level with a low-load control
Run a one-call control through the whole test, over the same minutes as every level, because a provider’s slowest responses move without any traffic from you. Coval’s STT benchmark, which measures speech-to-text models continuously on real-world audio, shows how far. Over the 30 days ending November 4, 2026, Deepgram’s Nova-3 returned its final transcript within 137 ms of the detected end of speech at p95, yet its slowest of 27,362 samples took 19,227 ms.
The benchmark sends no traffic of its own, so that 19-second maximum arrived with no load from you. Point the control at a separate deployment of the same agent, in its own workspace and with its own provider keys where the provider allows them, so it shares none of the level’s load, account limits, or queues. If the control drifts from the baseline described below, the provider moved: pause the test and rerun the affected scenarios one at a time after the load stops, as Coval’s testing guide advises, before reading anything into the failures. If only a level drifts, check provider errors and queueing.
The control can’t judge a level by itself. A single conversation gives too few turns in a minute to compute a p95 from, and the control completes only about 20 calls over the ramp, so one call moves its share of normal endings by 5 percentage points. Judge every level against a baseline instead, run at low load before the ramp: the full test set (20 test cases) at concurrency 2, each test case three times, which is 60 calls and about 90 minutes at three minutes a call.
Write pass/fail rules before the first call
Write each rule before the first call: a signal, how it is measured, and the threshold against the baseline at which a level fails. Time latency per turn, from the caller’s last word to the first sound of the reply, and judge it by a percentile such as p95; Coval’s voice AI latency guide covers how to measure that span. These are the six signals and the starting rules we’d use:
| Signal | Measure at each level | Starting rule (tighten as needed) |
|---|---|---|
| Turn latency | Per-turn p50, p95, and max at the caller | Each loaded minute’s p95 no more than 20% above the baseline’s p95, computed over all baseline turns |
| Call outcome | Share of calls that end normally (goal reached, planned hang-up) | Not lower than the baseline’s by more than chance explains (one-sided Fisher’s exact test, p < 0.05); review any call that ends for a reason the baseline never shows |
| Errors | Provider errors, connection failures, timeouts, HTTP 429s | No error type the baseline doesn’t show, and errors under 1% of requests |
| Turn-taking | Interruptions per minute; re-prompts (the caller repeating themselves) per call | Over the whole level, no more than 10% above the baseline |
| Transcription | Word error rate on the same recorded caller audio | Over the whole level, no more than 1 percentage point above the baseline |
| Network | Delay variation and packet loss, per 1-minute window | Every minute within ITU-T Y.1541 Class 0 |
Treat the table as a first draft and tighten each row once you know what your callers notice. The 1% error cap matches the load criterion in Microsoft’s example test plan, which defines error rate as the percentage of failed responses, and the network row comes from ITU-T Y.1541, the ITU-T standard for IP network performance: its Class 0 allows 50 ms of delay variation and 0.1% packet loss, judged over one-minute windows for telephony. The other margins are our suggested starting points, measured against your own baseline. Latency and network are judged minute by minute, so one bad minute can’t hide in a test-wide average. Call outcomes, turn-taking, and transcription need many calls or words to mean anything, so they’re judged over the whole level.
The call-outcome rule needs the most explanation, because a few dozen calls are a noisy sample. Fisher’s exact test asks whether a level’s abnormal endings exceed what chance would produce, given how many the baseline had; one-sided means it only looks for a level that is worse. With a 60-call baseline that had no abnormal endings, a 40-call level fails on its fourth abnormal ending (p ≈ 0.02), or its fifth if the baseline had one. A level catches only large drops: a 2-point drop, from 95% to 93%, takes roughly 1,800 calls on each side (the level and the baseline) to detect reliably. To catch a slow slide, compare the soak’s first hour with its last.
Turn-taking signals move early, because a caller who hears silence starts talking again, and Coval’s guide to turn detection covers how to test the agent’s side of that.
Abort rules come from the same table, and the values are yours to set. For example, stop a level once its abnormal endings reach the count that would fail it (four of 40 against a clean baseline), when an error type the baseline doesn’t show appears, or when a live caller is held.
A safe ramp schedule starts with 10–20-call steps and two-call-length holds
A ramp schedule starts at 5–10 calls, adds 10–20 per step, holds each level for two call lengths, and climbs until a pass/fail rule breaks. Four rules build it:
- Start small, with the control running, and step in fixed increments. LiveKit’s guide to load testing voice agents starts at 5–10 concurrent sessions, adds 10–20 per step, and warns: “Never go from zero to full concurrency in a single burst.”
- Pace each step to the slowest scaler. At Twilio’s default rate, the largest step below, 17 calls, takes 17 seconds to dial. On Pipecat Cloud, a new auto-scaled instance takes about 30 seconds to become available, so its capacity-planning guide says to keep whichever is larger warm: your usual number of sessions, or the calls arriving per second times that start-up delay. Before each step, reserve enough for the next level so no level waits on warm-up.
- Hold for two call lengths, longer if calls vary. For fixed three-minute calls, six minutes gives two full call-length windows after the level’s calls are connected; LiveKit asks for at least 5 minutes at the target. When call lengths vary, hold until latency and ending rates settle and enough calls have started and finished at that level.
- Climb until a rule breaks, then recover. Keep the steps fixed, because k6 warns that a sudden increase can make it hard to pinpoint why and when the system starts to fail. Then drop back to the average level and time how long latency takes to match the baseline again.
For the 900-call planning example, use fixed three-minute test calls and Twilio’s default dialing rate. The load levels exclude the separate one-call control:
| Level (calls) | Step | Dial time at 1 CPS | Hold | Why this level |
|---|---|---|---|---|
| 10 | +10 | 10 s | 6 min | Inside LiveKit’s 5–10 starting range |
| 20 | +10 | 10 s | 6 min | Retell’s Pay-As-You-Go default |
| 30 | +10 | 10 s | 6 min | Vapi Pro’s included lines |
| 45 | +15 | 15 s | 6 min | Average busiest-hour concurrency |
| 58 | +13 | 13 s | 6 min | 1% blocking with 3-minute calls |
| 75 | +17 | 17 s | 6 min | 1% blocking with 4-minute calls |
| 85, 95, … | +10 | 10 s | 6 min | Breakpoint climb until a rule breaks |
Through 75 calls, the idealized schedule takes about 37 minutes: six 6-minute holds plus 75 seconds of dialing, before connection delays or extra settling time. The held levels alone total 1,428 call-minutes: (10 + 20 + 30 + 45 + 58 + 75) × 6. Retell’s testing pricing bills tests “at the same rates as production,” roughly $0.07 to $0.31 per minute plus about $0.015 per minute of telephony on a Retell number, so those levels cost about $100–$443 plus $21. Budget the baseline (60 calls, or 180 call-minutes, about $13–$56 plus $3), the in-test control, startup, breakpoint climb, recovery, and retries on top.
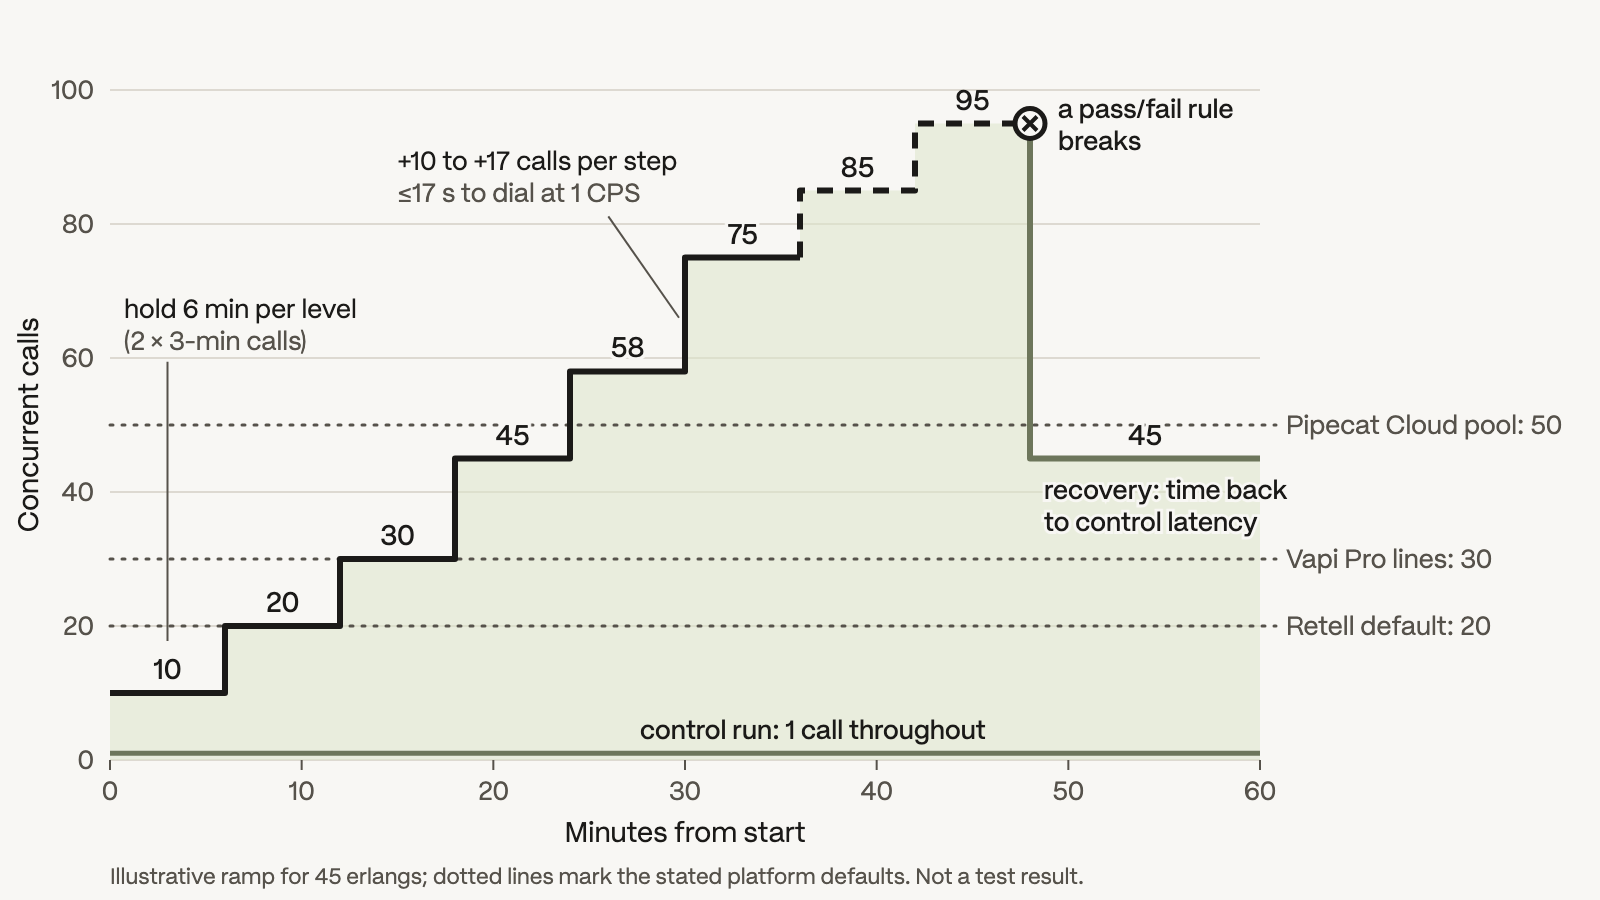
Illustrative ramp for 900 busiest-hour calls of three minutes, or 45 erlangs. Levels use Little’s law and the ITU-T Erlang B table; steps follow LiveKit’s 10–20-session guidance. Six-minute holds begin after the target is connected. Dotted lines mark the stated platform defaults; the break at 95 calls is illustrative, not a test result.
A ramp shows capacity when load arrives politely; a spike shows what happens when it doesn’t.
Spike tests expose limits that depend on arrival rate
A spike test jumps the call arrival rate, holds it for a minute or two, and drops back, to test what breaks when calls arrive faster than during a ramp. Run it even after the ramp passes, because the two can disagree: Google’s SRE book notes that, because of caching effects, a gradual ramp can give different results from an immediate jump to the same load. If a ramp holds 75 calls and a spike fails at 50, investigate cold starts, caches, new-session or CPS limits, and generator capacity before assigning the cause.
Size the spike in calls per second, not in concurrent calls. Real callers form what Gatling’s workload-model docs call an open system: they keep arriving whether or not the agent keeps up. A generator that holds a fixed number of calls is a closed system: as responses slow it starts fewer new calls, which hides the very overload the spike is meant to find and leaves the slowest minutes with the fewest samples, a measurement error known as coordinated omission. Compare the call rate you achieved with the rate you planned, and count calls that waited in a dialer queue or never connected as failures, not missing data.
AssemblyAI’s load profiles for voice agents put the spike at “10× in sixty seconds.” For the example agent, that means going from 0.25 to 2.5 calls per second for one minute: 150 calls instead of 15. If this deployment normally runs 45 sessions, Pipecat’s rule from the ramp section says to keep the larger of 45 and 2.5 calls per second × 30 seconds warm, which is 75 instances, more than Pipecat Cloud’s default pool of 50 can hold. Leave reservations at their production setting when the spike is meant to test cold starts.
Spikes also multiply signaling: the IETF’s SIP overload requirements show retries turning a single request into as many as 18 when UDP is used. Count retries at the SIP edge as well as failed calls, and watch new-session limits such as AssemblyAI’s per-minute cap, which a burst can hit before any concurrency limit.
Soak tests catch the failures that take hours to appear
A soak test holds a steady load below peak for hours to find what only time breaks, and it runs last, because hours of calls are only worth spending once the ramp and the spike have passed. k6’s soak testing guide names what it finds: slowing responses, memory and other resource leaks, data saturation, and storage depletion.
AssemblyAI’s soak profile is “Four hours at 70% of peak.” For the example agent, 70% of 45 calls is 31.5, so hold 32 calls for 4 hours: 7,680 call-minutes, about 2,560 three-minute calls. A soak is a stream of normal-length calls, not a few long ones, and platforms enforce that: Pipecat Cloud sessions are capped at 7,200 seconds (2 hours) by default.
Some limits only show up with time. OpenAI meters requests and tokens per day as well as per minute, so a test that passes for 10 minutes can still hit a daily cap in hour three. Chart these across the whole run and compare the first hour with the last:
- memory on each agent host, where a steady climb after warm-up suggests a leak
- open connections to providers and to your own services
- per-turn p95 latency by hour, against the baseline’s p95
- the share of normal endings and the mix of errors, first hour against last, to catch a slow slide
Read the curve: find the knee, then the component behind it
Plot each pass/fail signal against load to find the knee, then use stage timings to nominate the bottleneck, whatever generator produced the load.
Knee: the highest load level at which every pass/fail rule still held.
The shape past the knee matters as much as where it falls. In a good shape, calls above capacity get a fast busy or a fallback number while calls in progress keep working, which is how Google’s SRE book says a component should behave past its limit. In a bad one, calls connect and then stall, dragging down every call’s outcome at once.
Attribute the knee by stage. Chart STT time to final transcript, LLM time to first token, TTS time to first audio, and tool-call time at each level, plus CPU, memory, and GPU queue depth for any hosts you run. The stage that rises first is the candidate: check it against the provider signals from the limits table, such as HTTP 429s or AssemblyAI’s 1008 close, then change that one limit and repeat before assigning the cause. The same per-stage data carries into voice AI observability after launch.
Then turn the curve into a decision:
- List which rules broke first, level by level, against the baseline.
- Test which component and limit caused the first break, using stage timings and a controlled repeat.
- Compute headroom as (knee − target) ÷ target. A knee at 75 calls against the 58-call target is 29% headroom. A knee at 50 leaves the agent 14% short; if the agent runs on Pipecat Cloud, 50 is its default pool size, so that pool is the first limit to check.
- Fix the limit that caps capacity most, whether that’s a quota request, more reserved instances, or a code change.
- Rerun the ramp to find the next limit.
Every step so far, from the control run to the knee, needs callers who hold real conversations at a set level, and scoring for every call.
Coval runs each load level as a tagged run of simulated calls
Coval is purpose-built for testing voice and chat agents, and teams including Chime and Perplexity use it. In a Coval simulation, a simulated caller talks to your deployed agent end to end, with the accents and background noise your real callers bring, and Coval evaluates the conversation against criteria you define. Because Coval is vendor-agnostic, it works with whatever platform or provider is in your stack. Configure a separate tagged run for each level, then pilot it to confirm that connected load follows your schedule.
- Connect the agent the way callers reach it. An inbound voice agent takes a
phone_numberthat is either a full international number (E.164 format), routed over the public phone network, or a SIP URI. - Make the callers sound like yours. Configure each persona (the simulated caller’s voice, language, audio environment, and behavior) to match production, including accents and background noise. Keep every persona setting, including how often the caller interrupts, identical in the baseline, the control, and the loaded runs.
- Mirror your traffic in the test set. Mix scenarios in the proportions your intents arrive in, and reuse the same test set for the baseline and the control. Of Coval’s input types, a Scenario gives the simulated caller a situation to talk through, so it can react to a slow or wrong reply, which suits latency and outcomes; an audio upload plays the caller’s side exactly as recorded, which suits the transcription comparison.
- Launch a baseline, a control, and one run per level. Save the run settings in a template, setting Concurrency to the number of simulations that run in parallel, and give each level its own tagged run so the dashboard can separate the results. Coval load tests run up to 1,000 concurrent simulated calls, well above the 95 at the top of the example’s ramp, and the pricing page lists each plan’s concurrency. In the CLI,
--iterationsrepeats each test case up to 50 times:
# Baseline, before the ramp: all 20
# test cases, 3 times each, 2 calls
# at once (60 calls, ~90 minutes)
coval runs launch \
  --agent-id <AGENT_ID> \
  --persona-id <PERSONA_ID> \
  --test-set-id <TEST_SET_ID> \
  --iterations 3 \
  --concurrency 2 \
  --tags "load,baseline"

# In-test control: one call at a time,
# started with the ramp, on a separate
# deployment of the same agent
# (60 calls, ~3 hours; start another
# if the test runs longer)
coval runs launch \
  --agent-id <CONTROL_AGENT_ID> \
  --persona-id <PERSONA_ID> \
  --test-set-id <TEST_SET_ID> \
  --iterations 3 \
  --concurrency 1 \
  --tags "load,control"

# Level 20: 20 calls at once, each test
# case run twice (40 calls), enough to
# fill a 6-minute hold
coval runs launch \
  --agent-id <AGENT_ID> \
  --persona-id <PERSONA_ID> \
  --test-set-id <TEST_SET_ID> \
  --iterations 2 \
  --concurrency 20 \
  --tags "load,level-20"
For fixed-length calls, a level needs its concurrency times the hold, divided by the call length: 20 calls held for 6 minutes at 3 minutes each is 40 calls, and 58 calls is 116. In a pilot, check that connected calls follow your schedule, start the hold clock once they’re all connected, and allow extra calls for startup and long calls. Between full ramps, the GitHub Action adds a per-pull-request smoke check with a few simultaneous calls, so a change that hurts the agent under concurrency shows up early.
Score each level on how calls end, then read the runs by tag
Coval’s metrics cover four of the rules table’s six rows: outcome, errors, turn-taking, and, with traces, transcription. The other two come from your own data: per-turn latency from turn timings in your recordings or logs, and network quality from your Real-time Transport Protocol (RTP) statistics, the delay variation and packet loss at the media layer.
- Score how calls end. Use these metrics:
- Configure End Reason with the acceptable endings you defined before the test, and apply it the same way to the baseline, the control, and every level. It gives a YES/NO check per call, and the NO count is a level’s abnormal endings for the Fisher test. Watch
PIPELINE_ERRORfor simulation failures such as connection or provider errors. - Use Agent Needs Reprompting to count how often the caller had to speak again because the agent stayed silent too long.
- Track Latency and Interruption Rate to see whether the agent keeps callers waiting or talks over them as load rises. Latency reports each call’s average gap of at least 0.5 s between the caller finishing a turn and the agent responding, so its P95 and Maximum on the dashboard show the slowest calls rather than the slowest turns; the rules table’s per-turn p95 comes from your own turn timings.
- With OpenTelemetry traces, the trace metrics add STT, LLM, and TTS Time to First Byte, which show the stage that moved. For the transcription row, the same page’s STT Word Error Rate (Audio Upload) metric scores the agent’s transcripts against a ground-truth transcript you supply for a recorded caller.
- Configure End Reason with the acceptable endings you defined before the test, and apply it the same way to the baseline, the control, and every level. It gives a YES/NO check per call, and the NO count is a level’s abnormal endings for the Fisher test. Watch
- Read and alert by level. Use dashboards to compare each level’s median, P90, P95, P99, and Maximum. Filter each chart to one level’s tag so different loads do not blend into one result, and read each against the baseline’s. Set alerts to notify Slack, email, or a webhook when a level breaks a rule, or to route the triggered events to a human review project, so people check the calls your rules flag.
Coval’s simulation product lets you compare tagged levels using the same criteria as your regression tests.
Choose voice load testing tools by the question each one answers
Choose the generator by what the test needs to observe. SIP signaling tests call setup and capacity; fixed audio exercises the media path; responsive conversations let you judge whether the agent still handles the task under load. The generator also needs capacity of its own: LiveKit’s guide warns that your local ISP bandwidth likely can’t sustain hundreds of concurrent WebRTC connections, and suggests running the CLI from multiple machines.
| Tool | What it generates | Useful test boundary | Best for |
|---|---|---|---|
| Grafana k6 | Scripted load in stages, including arrival-rate ramps | An “open-source, developer-friendly, and extensible performance testing tool”; recommends a ramping-arrival-rate executor for breakpoint tests | Load shapes and backend APIs |
| Gatling | Scripted load in open or closed workload models | Open- and closed-model injection, built from levels and ramps | Open-model API load |
| SIPp | SIP calls at a set call rate | “a performance testing tool for the SIP protocol”; -r sets calls per second, -l caps simultaneous calls (per its control docs) | Raw SIP capacity |
LiveKit lk perf agent-load-test | LiveKit rooms with an echo participant | “creates rooms, dispatches your agent, and places an echo participant in each room that plays back the agent’s audio” | LiveKit agents, no phone line |
| Coval | Simulated callers that hold whole conversations, scored per call | Concurrency set per run, with load tests up to 1,000 concurrent simulated calls | Conversation quality at load |
SIPp has limited media support: it plays a G.711 or G.729 file into each call rather than listening and replying, so it tests the carrier edge and media path while the conversation goes untested. k6 and Gatling suit the booking, CRM, and knowledge-base APIs an agent calls, and LiveKit’s CLI is the shortest route for an agent in LiveKit rooms when no phone number is involved. When the load has to arrive over a real phone number or SIP address, Coval’s simulated callers reach the agent the way callers do and score every conversation.
These tools also combine. Run a SIP or dialer spike at the carrier edge while simulated conversations run through it, and the same minutes show whether calls connect and whether they still work.
Request quota increases weeks ahead, then ship when the knee clears the target
Quota and notice requests set the earliest date a full test can run, because their lead times range from hours to weeks. The Amazon Connect quotas page linked in the limits table says AWS can approve small increases in hours, while larger requests can take up to 3 weeks, and it recommends alerts at 80% of quota limits so you know when to ask. Get Twilio Business Profile approval and configure the higher CPS setting before scheduling a test that needs it. LiveKit asks for notice before tests of “more than a few hundred concurrent sessions.”
The calendar:
- Weeks before launch: file the increases your limits table calls for, sized to your Erlang target, and set the 80% alerts.
- The week of the test: confirm dashboards, alerts, autoscaling settings, and a rollback plan on a small run before the first full level.
- Ship when the knee sits above the Erlang target for the longer handle time, every rule held against the control, and the soak’s last hour matched its first.
- After launch, rerun on triggers. Coval’s guide to CI/CD for voice agents covers per-change regression runs. For load, the triggers are a provider or model swap, a region or infrastructure change, a prompt change that lengthens calls, and each traffic event.
Load is one gate in voice agent evaluation, next to whether the agent resolves the call: an agent that holds 75 calls and books the wrong appointment on every one of them still fails its callers.
Frequently asked questions
Can I load test in production?
Sometimes, with protections in place. Google’s SRE book suggests failure tests “in a small slice of production” once you believe the system is protected against overload. For a voice agent, that means a fallback number, sandboxed tools, and an abort rule tied to live callers first, then steps that start well below your busiest hour while you watch live calls’ latency as closely as the test’s.
What degradation is acceptable under load?
Whatever you wrote down before the test, measured against a control; the rules table above gives starting points. Microsoft’s example plan sets a baseline criterion of “95% responses under 2 seconds; error rate <0.5%” and a looser load criterion of “90% responses under 3 seconds; error rate <1%.” Those values are for a text agent, so borrow the structure: one criterion for normal load, a looser one for peak.
How is voice load testing different from IVR testing?
IVR testing checks that every route through a phone menu plays the right prompts and ends in the right place, as Coval’s IVR testing guide explains; voice load testing checks that the system still works at peak volume. The two combine well: place a handful of route tests through the load generator while the system sits at its sized peak, and see whether keypresses still register and codecs still match production.
How do I load test a hosted voice agent API such as Deepgram’s?
Treat the API’s connection limit as the limit for your whole platform, and test from the region you will deploy in. Check your account’s allowance against the limits table, because plan and region change the binding limit. If the API doesn’t report its own stage timings, measure per-turn latency at your client and count connection errors per level, since you can’t split a knee into STT, LLM, and TTS from outside.
The capacity you can rely on is the load at which callers still get a timely, correct result, not the number of calls a generator requests. Make your first run a small pilot that proves the call path, connected load, and scoring work together. That gives the larger test a trustworthy starting point and makes its eventual limit useful for a launch decision.